by Mark Perry

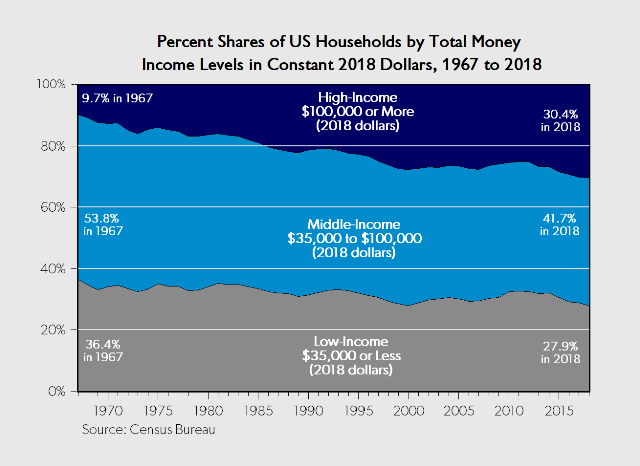
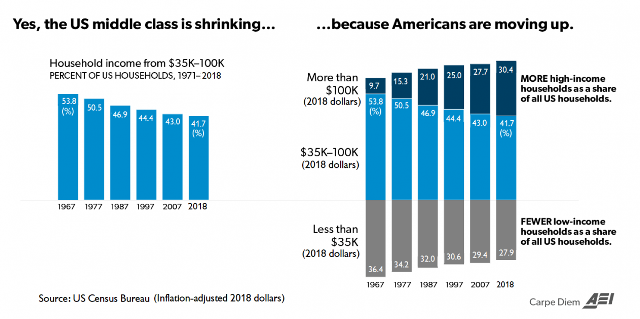
The new animated “bar chart race” visualization above is a dynamic version of the second static chart, and both show the percent shares of US households by total money income for three income categories annually from 1967 to 2018: a) low-income households earning $35,000 or less, b) middle-income households earning between $35,000 and $100,000 and c) high-income households earning $100,000 or more (all in constant 2018 dollars). The income data are from the new Census Bureau report released today “Income, Poverty and Health Insurance Coverage in the United States: 2018.” The third chart above is another way to visualize what might be among the most important finding in the new Census data and confirms a continuation of a trend I’ve highlighted many times before on CD.
Here’s how I explained the income share trends displayed above in a post on CD a year ago discussing last year’s Census report, updated with this year’s data.
Yes, the “middle-class is disappearing” as we hear all the time, but it’s because middle-income households in the US are gradually moving up to higher income groups, and not down into lower-income groups. In 1967, only 9.7% of US households (fewer than 1 in 10) earned $100,000 or more (in 2018 dollars). In 2018, more than 1 in 4 US households (30.4%) were in that high-income category, a new record high. In other words, over the last half-century, the share of US households earning incomes of $100,000 or more (in 2018 dollars) has more than tripled! At the same time, the share of middle-income households earning $35,000 to $100,000 (in 2018 dollars) has decreased over time, from more than half of US households in 1967 (53.8%) to less than half (only 41.7%) in 2018. Likewise, the share of low-income households earning $35,000 or less (in 2018 dollars) decreased from more than one-third of households in 1967 (36.4%) to below one-third of US households last year (27.9%), a new record low.
Bottom Line: As can be seen in the visualization above, America’s middle class did start largely disappearing in the 1970s, but it was because they were moving up to higher-income groups, not down into a lower-income category. And that movement was so significant that between 1967 and 2018, the share of American households earning incomes above $100,000 more than tripled, from 9.7% to 30.4%. Many prominent people like Paul Krugman and progressive politicians like Sen. Bernie Sanders and Sen. Elizabeth Warren claim that American’s middle class has been declining, disappearing, collapsing, losing ground, vanished, stagnated, etc. But the Census Bureau data on household income over time displayed above demonstrate conclusively that those assertions are incredibly and verifiably wrong.
Think about it for a moment and let it sink in — in 2018 nearly one out of three (and more than 39 million) US households had annual incomes of $100,000 or more. And the share of American households with that level of income has increased by more than three times since 1967! Then compare that picture of a prosperous America with millions of middle-class households moving up into higher income groups to the narratives we hear all the time that the American middle class is: losing ground, falling behind, collapsing, stagnating, disappearing, fill in the blank ___________.
Posted with the kind permission of the author. Read original post here…