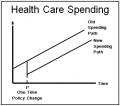
Do you think it’s possible to demonstrate with a single graph the fallacy behind every wrong-headed solution to the problem of rising health care costs? See the accompanying figure.
 I call this graphic the "Health Fork," because it reminds me of a tuning fork and it has the power to fine tune potentially sloppy thinking. Once the diagram becomes widely known, it can serve several useful purposes:
• A postcard version could be used by journal editors to signify rejection of poorly conceived manuscripts, thereby saving the time and money costs of peer review.
• A placard version could be used to visually reject ill-advised health policy speeches instead of hissing and booing.
• A gold-plated version could be worn as a lapel pin by clear thinkers so the two of you will know who you are at the next event sponsored by the Center for Health Systems Change.
Basic Problem, Solutions
Health care spending is growing at twice the rate of U.S. personal income growth. If that trend continues, health care will eventually crowd out every other form of consumption. This spending path is illustrated by the upper line in the graph.
There are really only two ways to change that path: (1) on the demand side, someone must choose between health care and other uses of money; and (2) on the supply side, health care must be produced in a competitive market, which means providers must compete for patients on the basis of price and quality.
The solutions that work are so unpalatable to so many in the health policy community they have become unthinkable. So the only thing left to talk about, hold conferences about, etc., is solutions that don’t work.
Solutions that Don’t Work
Among the solutions that don’t work are proposals (some otherwise commendable in their own right) that may lower spending at time t* in the diagram, putting us on the lower spending path. But once the change has occurred, spending continues to climb at twice the rate of growth of income.
Note that a downward parallel shift in the cost curve does not prevent inevitable disaster; it merely delays the onset of the catastrophe. Here are a few examples:
1. Keeping Our New Year’s Resolutions
We eat less, drink less, smoke less, exercise more, etc. These are good things to do, and they would cause a one-time lowering of the spending line. But from that point on, costs would grow at the same rate as before.
2. Adopting the Commonwealth 15
Fifteen ideas for controlling costs, that is. The New York Times endorsed the whole batch, and I suppose the Commonwealth Fund should get some credit for imagination and creativity. Could you think of 15 cost-control ideas that do not require anyone, anywhere to choose between health care and other uses of money and do not require any provider, anywhere to compete for patients? I couldn’t.
3. Cutting Administrative Costs
People who have never in their whole life complained about bureaucracy froth at the mouth over the thought of private health insurance overhead. Even if they’re right about their claims and even if we could eliminate the excess burden (putting us on the lower spending line), from that point on the rate of growth of per-capita spending would change not one iota.
4. Squeezing the Doctors
Most other developed countries try to reduce spending by cutting providers’ pay. Whereas U.S. doctors earn five times the average American’s wage, in Germany and Canada it’s only about three times, and in Sweden and Britain it’s 1½ times. Suppressing provider incomes, however, does not lower costs; it merely shifts those costs from patients and taxpayers to providers. Disguising true social costs in no way reduces the rate of change of those costs.
5. Copying Other Countries
The United States spends more of its income on health care than any other developed country. Or, so everybody says. Trouble is, in modern health care systems nobody ever faces a real price for anything. As a result, no country really knows what it spends on health care.
By physical count, the U.S. is not profligate. We have fewer doctors per capita, fewer hospital beds, fewer hospital stays, etc. However, on paper the U.S. experience looks like the upper growth path, while the experience of other developed countries (with many costs disguised) looks like the lower path. The slopes are the same, nonetheless.
For the past four decades, the U.S. rate of growth of per-capita health care spending (4.4 percent) has been right at the OECD average (4.5 percent)!
John C. Goodman (john.goodman at ncpa.org) is president of the National Center for Policy Analysis. Visit his health care blog by clicking here…

